This is a follow up to my last article Sales Bridge 101, if you have not already read that please do first.
Our goal here is to dive a bit deeper. I find that most of my conversations with entrepreneurs at The LegalTech Fund are focused around working on either reviewing a companies sales bridge or helping them think through their underlying assumptions to test for feasibility. Let’s look at some of the categories in columns below:
In order:
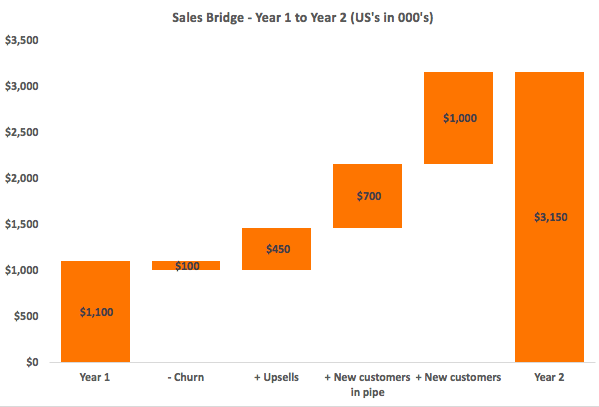
Year 1: This is simple, as this is factual, it is where ever you ended the year (or time period).
Churn: I like to look at this in a positive context, customer health. Your Customer Success or Customer Support team should be tracking this in some way. If so are you highlighting at-risk customers? Reserving something in general for Churn? If so, these are the numbers that need to flow through to your sales bridge.
Upsells: This category may be tracked on the sales side or on the customer success side, but either way, you need to weight these and then put those probabilities into your sales bridge (and assumptions into the operating model).
New customers in pipe: Should be tracked through a CRM or any other place that you are tracking this information that should flow though.
New customers: This is a catch all. This is the gap in ARR that you need to achieve, but don’t necessarily have line of site to. This category is the most important and usually needs the strongest thought process around the assumptions. To unpack this a bit further, lots flow into this and this can go in lots of directions and this is the category that goes way beyond sales activities because these are leads that are not yet in existence. We can trace these all the way back to marketing Quick example of how far to walk this back:
Our graph above says $1,000 is needed in closed business
That means that we need to have $10,000 put into the pipeline (if you assume a 10% conversion rate on thing that enter the pipeline.
This means that we need to touch $50,000 worth of customers (assuming that 20% of our marketing efforts lead to pipeline additions).
That may mean that we need to touch 100 customers (if they are worth $500 apiece) and to do so, we may need to attend 25 conferences (if we meet 4 customers per conference)
So each of the last few steps could be their own unique sales bridge.
All of this adds up to Year 2 ARR.
All of these categories should be flowing in and out of your operating model as well and the neat part is if that if all of these are linked together, you can really manage your business by using data vs. anything else.
Throughout this process, you are making tons of assumptions. It is important that all of these assumptions also are revisited quite frequently and tightened up. In the beginning – these are all just assumptions, its ok if you are way off. The important part is are you making quick changes and are the assumptions moving in the right direction.