Four years ago, I wrote an article titled “Hitting your sales goals – get the basics down first” covering two subjects:
1. How to build out a sales team / infrastructure (specifically for early / seed stage companies).
2. What a sales bridge is.
For #1, I am less of an expert and was sending out some high-level thoughts. Like anything on this blog – take the advice or leave it! On the other hand for #2, I have sat with a ton of entrepreneurs and when they cannot unpack their sales projections, it immediately triggers a lack of confidence of both them and their business (especially if they act with an ere of confidence).
So what I wanted to do was highlight some of the thoughts from that article and then I plan to have a part II of the article that goes a bit deeper.
This is specifically focused on enterprise SaaS companies.
Highlights from the first article:
For simplicity, lets think about your Annual Recurring Revenue (ARR) in Year 1 and where you want to get to at the end of Year 2 (this exercise can be done from any point 1 to point 2, we are using year / ARR for simplicity) and then we will bridge how we get from year one to year two.
Year 1 ARR + Changes = Year 2 ARR
The more you unpack the “changes” the more visibility you have and you have a higher chance of getting to your goal(s).
Let’s unpack “changes” one layer deeper that when summed should lead to significant growth for an early stage company:
Changes = Churn + Upsells (to existing customers) + Pipeline + any projected gap to get to your numbers (which can be solved for later)
Now if you choose to, you can unpack each one of them to get to your goals. The more depth you go into, the more that you can focus on a plan to make sure that you are going to achieve your goals and course correct if you are not heading in the right direction.
Here is a bridge graph that is a visual of what we just went over:
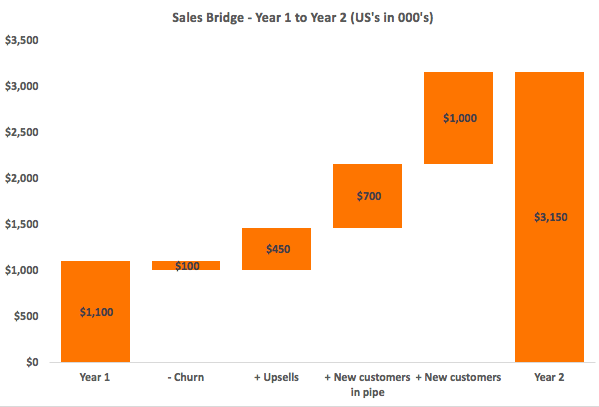
Now that we have a basic understanding as to the broad buckets, how do we back into what we have to be doing to achieve the goals? Let’s take the “New Customers” (future customers that do not currently exist on the pipeline). In the sales bridge, we see a goal of $1M. If our product is $100,000 per license per year, then we are going to need to close 10 new customers. To close 10 new customers, we know that we need to be talking to 100 customers by the end of August (since there is a four-month sales to close cycle). To talk to 100 customers, marketing needs to generate 1,000 leads and our current website is only generating 50 leads per month (8 months x 50 leads per month = 350 leads). So how do we find the additional leads that we need? That is how you unpack a number and start to thinking about every aspect of your business. This work backwards concept makes you pay attention to the details.
# of new to be identified customers x revenue per customer = New to be identified customers
companies in dialogs x conversion rate = # of new to be identified customers
# of companies who make it to website x % of companies that fill out lead form = companies in dialogs
By this stage you likely see where this is going and how all KPI’s for different groups can be backed into by running an exercise of just asking a simple set of questions around your revenue projection.
The fun part of this is to start tracking progress against it, where you add in a new variable: business booked.
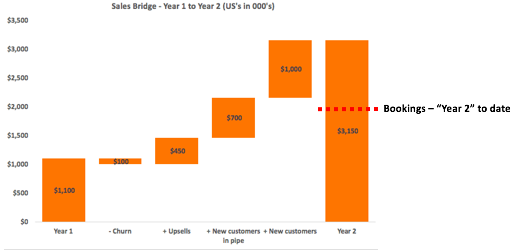
After this exercise, I promise you additional clarity and now your goal feels manageable or not, but either way with frequent updating you will have visibility into over or underperformance which will be critical to managing your capital and stakeholders.
For the next post in this series, where we dive deeper into the underlying assumptions, please see Sales Bridge 102.
__
Here is a sales bridge template used above. Please rethink all formulas, as each build requires a different set of formulas.